

Thankfully the US stock markets were only open for a half-day of trading Dec 24th. Investors and traders alike were stuck in a frenzied sell driving the S&P 500 down to 2346. Had the bell not rung the frenzy would have driven the market even lower. Christmas day’s market closure seems to have given everyone a much needed Moonstruck “snap out of it” slap to the face!

The following day the Dow Jones Industrial Average had its single highest point gain (note: point not percentage). So what are we to make of such stomach-churning daily moves? As so often is the case, history provides some valuable perspective and possible lessons. I’ve been advising nearly 30 years, and have lived through two of the worst bear markets ever and two of the biggest bull markets ever. I find it interesting that scars from bad experiences seem to leave deeper marks on our psyche than positive ones. Maybe this is why so many repeatedly make the mistake of thinking the next bear market will be like the last one – which has not been the case so far since the S&P 500 data started. Since the US market bottomed after the 2008 financial crisis, an ever-growing crowd of “market prognosticators” has warned at any sign of even the slightest trouble that 2008 doomsday is around the corner. Since 2009 there have been warnings of the next crash.
Two famous sayings come to my mind: “even a broken clock is right twice a day” and “history doesn’t repeat itself but it often rhymes”.
Remember market intraday lows from the peak dropped a-hair-under 20% of intraday lows in 2011. Many said it was a new bear market amidst fears of government (sovereign) debt defaults and falling global growth, especially negative growth in Europe. In 2010 it was a 16% correction which many in 2011 were saying was the warning sign to trouble. During the August 2011 meltdown, oil prices plunged along with other commodities and cries of the next financial crisis could be bigger than 2008! All the while market analysts were saying then that credit markets were healthy and the US banking system was stronger than it was a few years earlier, so a repeat of the financial crisis was unlikely. But fear of the future drove the crowd and could not be calmed by positive data nor analysts’ comments. It was called a crisis of confidence by Georgetown University Finance Professor, Reena Aggarwal. In hindsight, it was an emotional overreaction.
Recall the 2013 bond selloff (a.k.a. taper tantrum) when bond traders panicked from Ben Bernanke’s speech that “the Fed was going to stop buying bonds since the US was stronger now.” In that Market Update, I said: “analysts were misreading Mr. Bernanke’s message and acting like he was going to sell bonds rather than just stop buying them.” Once again, traders and investors feared the future, ignoring the actual data.
Then came the month-long double-digit selloff in 2014 which was over fears that Europe and Asia’s slowing growth would weigh on the US, hence the US Federal Reserve’s ending quantitative easing and geopolitical anxieties. Arguments of whether this was the beginning of the next ’08 like crash were had daily in the financial press. Again, fear of the future Euro economics and Fed action spooked the masses.
Jump forward to Q1 2016, when US stocks again sold off fast and furiously during the first 5 weeks of the year on fears of slowing growth in China, oil price decline, and the US Fed raised interest rates 0.25%. Fears about how many times the Fed may raise rates in 2016 was 4 more times in the year when in actuality the only rate hike in 2016 occurred in December at 0.25%. This was a year after the 0.25% increase in Dec 2015 that sparked the sell-off earlier.
Here we are ending 2018, ready for next quarterly earnings cycle and reports of US banks financial strength, corporate balance sheets, retail sales, & employment seem to be ignored amidst fear of plunging oil prices and the future (European economic trouble, slowing growth in China, the Feds may raise interest rates). Yet we still have not broken the trading channel in place since the bottoms of 2009. Previously I stated: “a break below 2300 (S&P 500) level would indicate a 9-year channel has been broken (see chart below) and to me would indicate a whole new level of bear market is underway. On the other hand, if the market trades down to these levels and bounces off, then it could indicate a buying opportunity.” 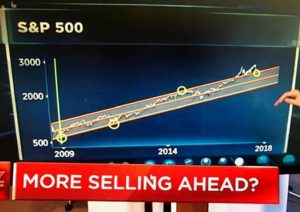
In summary, fear and hope are not sound investment strategies. Only time will tell if this is another sell-off that is a buying opportunity within a bull market OR if it’s the first round of a new bear market. But the markets strong rally the day after the biggest point-gain sure seems like a bounce off the bottom of the same trading channel we’ve been in since 2009 that is akin to 2011, 2014, 2016. If the S&P 500 should break below 2300 before quarterly earnings start in a few weeks, then I believe that is a signal that this sell-off is a whole new bear market with more downside ahead and would seek to change investment strategy. Remember emotions are to investing like drinking is to driving: a terrible mix. Rather than speculate or guess, I’ll continue to rely on data and look to use short-term fear to gain long-term potential.
Please Note: As you link to websites posted here, we make no representation as to the completeness or accuracy of information provided at these websites. Opinions expressed are that of the author and are not endorsed by the named broker/dealer or its affiliates. All information herein has been prepared solely for informational purposes, and it is not an offer to buy, sell, or a solicitation of an offer to buy or sell any security or instrument to participate in any particular trading strategy. The information in this article is not intended as tax or legal advice, and it may not be relied on for the purpose of avoiding any federal tax penalties. You are encouraged to see tax or legal advice from an independent professional advisor. Certain statements contained within are forward-looking statements including, but not limited to, statements that are predictions of future events, trends, plans or objectives. Undue reliance should not be placed on such statements because, by their nature, they are subject to known and unknown risks and uncertainties. The S&P 500 Index is a widely recognized index including a representative sample of 500 leading companies in leading sectors of the U.S. economy. The Nasdaq 100 Index is made up of the 100 largest non-financial companies traded on the Nasdaq stock exchange. These indexes are unmanaged. Investors cannot invest directly into indexes. Past performance does not guarantee future results