

UPDATE: November 2018
Following up on my last Market Update with all the market headlines and bombastic coverage of the sell-off, the S&P 500 currently is trading around 2650 which is almost the same level as when I wrote the Market Update October 30th. Remember emotions to investing are like what drinking is to driving: a terrible mix.
I wrote in the Market Update attached below: “Should the market fall back, thus back into the old trading channel (shown in the picture above) then as Mr. Worth stated the S&P 500 could correct back to the median of the old trading channel that would be around the 2500 level, or another 7% lower from yesterday’s close. A sell of this magnitude could be quickly reversed after the mid-term elections next week. Still, this would be a key level should the selloff continue again. To me this is where some may want to re-reduce risk assets and raise more cash or implement some downside hedging within their portfolio because as Mr. Worth goes on to explain that if the S&P 500 breaks below 2500 then he believes trading back to the bottom of the channel as it did in October 2011 and Feb. 2016. Should that happen that would be around the 2300 level, approximately 14% lower from Monday’s close. A break below this level would indicate a 9-year channel has been broken and to me would indicate a bear market is underway. On the other hand, should the market trade down to these levels and bounce off along with the current economic/political trends then it could indicate a buying opportunity. “
Tuesday morning (11/20/2018) stocks opened noticeably lower with many names and the indexes bouncing only slightly off of the intra-day lows so far. So, markets remain at a crossroads and have not signaled yet if this is a fired drill (correction within a bull market) or if it’s the start of a new bear market. “…the first key level to watch is 2500 in the S&P 500 index (about 6%below today). A break below this would make me want to reduce risk considerably and implement some portfolio hedging in anticipation of dropping to around 2300 for the S&P 500. Unless the S&P 500 breaks below the 2300 level, it is still within the trading channel which began at the end of the financial crisis (3/2009). It is starting to look like a market trying to find the bottom but I’d want to see further rally off of the lows before considering it a real bounce. I hope you and your loved ones have a happy Thanksgiving.
———————————————————————————————————————
Panic selling can offer attractive opportunities. On Monday, October 29th I witnessed the emergence of panic in the markets. Thus far the markets are playing out as I wrote in the June 24th Market Update, ‘Corsican Brothers’ : “I expect the markets will overreact to news in the short term. Meanwhile the earnings trajectory of growth remains THE fundamental data point to the short & intermediate term. So, for the next two quarters do NOT get caught in daily ups and downs as I expect the markets could especially be volatile with the added joy of living through another media flamed firestorm: US mid-term elections.” And in the Aug 16th Market Update, ‘Turkey is Just a Garnish’, I wrote: “Chinese debt is THE boogeyman with which I am concerned. Turkey appears nothing more than a dish of olives upon the buffet table. The appetizers being – interest rates, earnings, earnings forecasts, and US corporate capital investing which all look really tasty. But the main entrée is Chinese debt and it’s still in the oven”. With all the variables in the markets we need to ask, is this current sell-off a fire drill and thus a buying opportunity or is it the real thing and we should flee to safety across the board?
On Monday, Oct 29th, the S&P 500 Index closed at 2641. Renowned market technician, Carter Worth of Cornerstone Macro put together a chart on CNBC after-market hours (you can view it on YouTube), showing that since the lows of Financial Crisis of 2009 till now, the S&P 500 Index has traded in the channel. The index didn’t break out of the channel until the rally peaks a month ago and the current correction as of Monday (10/29) has merely brought the index back into the channel (image below).
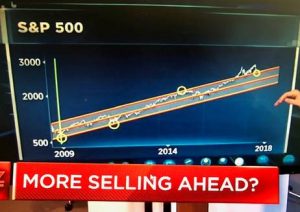
One thing he surprisingly didn’t note is that when we broke above the trading channel recently and traded there for an extended time, that was a bullish sign that brought on more buying because the index began a new higher channel. Think of it like you were bouncing up and down in your room on the 2nd floor of a building and now you jumped through the ceiling into a room on the 3rd floor. The current sell-off has merely brought us back to the top of the old trading channel or it could be the bottom of a new trading channel; hence a crossroads. (Using the previous hotel floor analogy, we’re waiting to see if we fall down to 2nd floor or if we’re simply at the bottom of the room on the 3rd floor).
Thus far the market is rallying, which still leaves us asking fire drill or a real bear market? Just as you drill and prepare in case of an emergency, investors need a plan of action too.
Should the market fall back into the old trading channel (shown in the picture above) then as Mr. Worth stated the S&P 500 could correct back to the median of the old trading channel that would be around the 2500 level, or another 7% lower from yesterday’s close. A sell of this magnitude could be quickly reversed after the mid-term elections next week. Still, this would be a key level should the selloff continue again. To me this is where some may want to re-reduce risk assets and raise more cash or implement some downside hedging within their portfolio because as Mr. Worth goes on to explain that if the S&P 500 breaks below 2500 then he believes trading back to the bottom of the channel as it did in October 2011 and Feb. 2016. Should that happen that would be around the 2300 level, approximately 14% lower from Monday’s close. A break below this level would indicate a 9-year channel has been broken and to me would indicate a bear market is underway. On the other hand, should the market trade down to these levels and bounce off along with the current economic/political trends then it could indicate a buying opportunity.
With earnings and the economy continuing to show solid signs – not too hot and not cold –
let’s examine the potential impact of the Nov 6th mid-terms.
Based on analysts’ reports and calls it appears that investors are pricing in a split Congress after the election. Unless there is a complete reversal of both Congressional bodies, I continue to believe the stock markets may follow historical precedent and rally after the election. Sometimes rallies can snapback.
In summary, recent sell-off is following mostly along my earlier expectations as a whole and I expect the markets to remain at a cross-road until the election is over. If selling resumes then the first key level to watch is 2500 in the S&P 500 index (about 6% below today). A break below this would make me want to reduce risk considerably and implement some portfolio hedging in anticipation of dropping to around 2300 for the S&P 500. My 28 years in this business have taught me that trying to time markets is folly. To me, it’s prudent to manage cash to help smooth out volatility and use times of fear to acquire long-term potential by seizing upon short-term panics in the markets and let the data, not emotions drive decision making.
Please Note: When you link to any of the websites provided here, you are leaving this website. We make no representation as to the completeness or accuracy of information provided at these websites. Opinions expressed are that of the author and are not endorsed by the named broker/dealer or its affiliates. All information herein has been prepared solely for informational purposes, and it is not an offer to buy, sell, or a solicitation of an offer to buy or sell any security or instrument to participate in any particular trading strategy. The information in this article is not intended as tax or legal advice, and it may not be relied on for the purpose of avoiding any federal tax penalties. You are encouraged to see tax or legal advice from an independent professional advisor.
Certain statements contained within are forward-looking statements including, but not limited to, statements that are predictions of future events, trends, plans or objectives. Undue reliance should not be placed on such statements because, by their nature, they are subject to known and unknown risks and uncertainties.
The S&P 500 Index is a widely recognized index including a representative sample of 500 leading companies in leading sectors of the U.S. economy. The Nasdaq 100 Index is made up of the 100 largest non-financial companies traded on the Nasdaq stock exchange. These indexes are unmanaged. Investors cannot invest directly into indexes. Past performance does not guarantee future results.